Parsing
plopy loops over the lines in a file, splitting lines into columns by
spaces or commas. If every column can be converted to a value, the values are
added to an array. Then, if the array has at least one row and the number of
columns does not change from row to row, the file is plotted.
This process will work on files where columns are delimited by spaces, commas, or a combination of both, and will automatically skip headers or other lines that cannot be parsed.
Dates
plopy will attempt to parse dates automatically with dateutil.parser
if parsing as float is not successful. This will parse ISO-formatted dates
with any delimiter between them, except spaces or commas
(since that will result in parts of the date being treated as separate columns).
If there are spaces in the date, make sure the file is in .csv format.
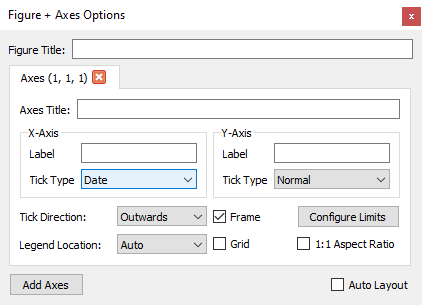
Dates are then converted into matplotlib’s representation of dates as the
number of days since the year 0. To display this as a proper date,
set the tick type to Date in Edit > Figure + Axes Options.
Note that this won’t work if negative numbers are included in the column
that is set to be displayed as dates.
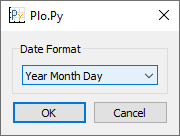
If the file’s dates aren’t in ISO 8601 format, you can
choose a different format in File > Choose Input Date Format.
When working with very large files that take a significant time to load,
consider using the Load Input File with Fast Date Processing... option,
which uses datetime.datetime.strptime. It requires manually specifying
the format, such as %Y-%m-%dT%H:%M:%S, but can run significantly faster
(31 vs 142 seconds on a 86 MB file).
A full list of format codes can be found
here.